Ethereum is more than just another cryptocurrency. It is a global technology platform that powers smart contracts, decentralized apps, NFTs, and much more. Because of this, Ethereum attracts traders, long-term investors, developers, and institutions from all over the world.
Understanding ethereum price technical analysis helps investors make better decisions instead of guessing or following social media hype. Technical analysis does not predict the future perfectly, but it helps identify trends, momentum, and key price levels.
This guide is written for beginners and professionals alike. You do not need advanced math skills or trading experience. Everything is explained in very simple, step by step.
What Is Technical Analysis in Crypto?
Technical analysis is the study of price charts and trading data to understand market behavior. Instead of focusing on news or emotions, it looks at patterns formed by buyers and sellers.
In crypto markets, prices move fast. Technical analysis helps investors:
- Identify trends
- Find good entry and exit points
- Manage risk better
- Avoid emotional trading
Unlike stocks, crypto trades 24/7, making technical tools even more important.
Why Ethereum Technical Analysis Is Different From Bitcoin
Ethereum behaves differently than Bitcoin for several reasons:
- Ethereum has real utility through smart contracts
- Network upgrades can strongly affect price
- Gas fees and network usage influence demand
- DeFi, NFTs, and Layer-2 solutions impact activity
Because of this, Ethereum price movements often follow both market sentiment and network growth.
Understanding Ethereum Price Charts (The Basics)
Before using indicators, it is important to understand charts.
Candlestick Charts Made Simple
Each candlestick shows:
- Opening price
- Closing price
- Highest price
- Lowest price
Green candles usually mean price went up.
Red candles mean price went down.
Over time, these candles form patterns that reflect market psychology.
Key Trends in Ethereum Price Movement
Uptrend
- Higher highs
- Higher lows
- Buyers control the market
Downtrend
- Lower highs
- Lower lows
- Sellers dominate
Sideways Market
- Price moves within a range
- Often happens before a big move
Knowing the trend helps investors avoid trading against the market.
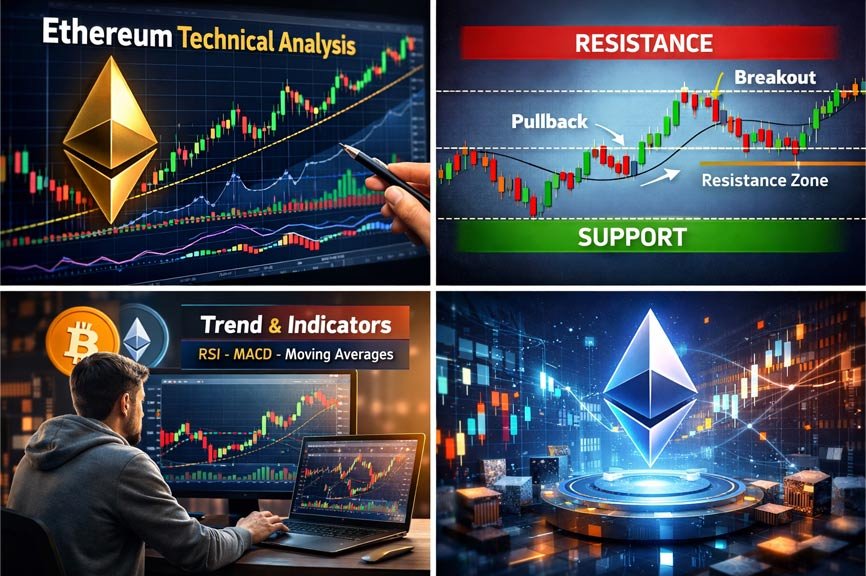
Support and Resistance Levels Explained
Support and resistance are price zones, not exact numbers.
Support
- Area where buyers usually step in
- Price tends to bounce upward
Resistance
- Area where sellers take profit
- Price often struggles to move higher
Smart investors buy near support and sell near resistance when the trend confirms.
Most Popular Indicators for Ethereum Analysis
Moving Averages (MA)
Moving averages smooth out price action.
- Short-term MA: shows quick trends
- Long-term MA: shows overall direction
When price stays above major moving averages, sentiment is usually bullish.
Relative Strength Index (RSI)
RSI measures momentum.
- Above 70: overbought
- Below 30: oversold
RSI helps avoid buying when price is already too hot.
MACD Indicator
MACD shows momentum shifts.
- Bullish crossover: possible upward move
- Bearish crossover: possible downward move
It works best when combined with trend analysis.
Volume: The Hidden Truth Behind Price Moves
Price without volume can be misleading.
High volume means:
- Strong market interest
- Price move is more reliable
Low volume means:
- Weak conviction
- Higher risk of fake breakouts
Ethereum rallies with rising volume are usually healthier.
Ethereum Market Cycles and Investor Psychology
Crypto markets move in cycles:
- Accumulation
- Uptrend
- Distribution
- Downtrend
Understanding these phases helps investors stay patient and avoid panic selling.
Fear and greed drive most price swings. Technical analysis helps remove emotions.
How Global Events Affect Ethereum Price
Ethereum reacts to:
- Interest rate decisions
- Regulation news
- Network upgrades
- Institutional adoption
- Tech innovation in blockchain
Technical analysis does not ignore news but helps confirm if the market truly believes it.
Common Mistakes Beginners Make
- Using too many indicators
- Ignoring risk management
- Trading without a plan
- Following influencers blindly
- Overtrading small price moves
Simple strategies often work better than complex ones.
Risk Management: The Rule Most People Ignore
Good analysis means nothing without risk control.
Smart investors:
- Use stop losses
- Never risk more than they can afford
- Diversify their portfolio
- Think long-term
Protecting capital is more important than chasing profits.
Long-Term vs Short-Term Ethereum Analysis
Short-Term Traders
- Focus on charts and indicators
- Trade smaller moves
- Need strict discipline
Long-Term Investors
- Focus on trends and fundamentals
- Ignore short-term noise
- Use technical levels to buy wisely
Both approaches can work if done correctly.
Ethereum Price Technical Analysis for Beginners (Simple Summary)
For beginners, focus on:
- Overall trend
- Support and resistance
- One or two indicators
- Risk management
Complex strategies are not needed to succeed.
FAQs – Ethereum Technical Analysis Explained
1. Is technical analysis reliable for Ethereum?
Yes, it helps identify trends and key levels, but it is not perfect. Always combine it with risk management.
2. Can beginners use Ethereum technical analysis?
Absolutely. Start simple and learn gradually.
3. Which indicator is best for Ethereum?
There is no “best” indicator. Moving averages and RSI are beginner-friendly.
4. How often should I check Ethereum charts?
Long-term investors can check weekly. Traders may check daily or hourly.
5. Does news override technical analysis?
Big news can cause sudden moves, but charts often show signs before major events.
6. Is Ethereum a good long-term investment?
Ethereum has strong technology and global use cases, but every investment carries risk.
Conclusion: Final Thoughts for Smart Investors
Ethereum continues to play a major role in the global crypto and tech ecosystem. Learning ethereum price technical analysis helps investors understand market behavior instead of reacting emotionally.
You do not need to be an expert trader. Start with basics, stay patient, and focus on long-term learning. Over time, technical skills improve naturally.