Dogecoin began 2026 in a way few assets ever do: with a historic regulatory victory that the market promptly ignored. On March 17, 2026, the SEC and CFTC jointly classified DOGE as a digital commodity — placing it alongside Bitcoin and Ethereum in the most favorable regulatory category available under U.S. law. It was the clearest institutional endorsement in Dogecoin’s 12-year history.
The price fell anyway. Within days of the announcement, DOGE slipped under $0.10, touching $0.091 on March 23 — nearly 10% below where it was trading when the classification was announced. This is the central puzzle of any credible Dogecoin price prediction for 2026: why is good news not working? And what does that tell us about where DOGE actually goes from here?
This analysis cuts through the noise. It does not promise $5 or $1 by year-end — targets you will find plastered across social media with no methodological grounding. Instead, it builds a structured, evidence-based framework using technical indicators, on-chain data, macro context, and a specific insight that most market commentary is missing entirely.
The Regulatory Paradox: Good News in a Bearish Structure Is a Contrarian Signal
The most overlooked pattern in DOGE’s 2026 price action is what behavioral finance calls “buy the rumor, sell the news” in reverse: when a heavily anticipated positive catalyst (commodity classification, ETF launches) fails to produce any sustainable rally, it signals that the market’s underlying supply-demand structure is more bearish than the headlines suggest. DOGE has now had three major bullish catalysts the REX-Osprey DOGE ETF launch in September 2025, the 21Shares spot ETF in January 2026, and the SEC/CFTC commodity ruling in March 2026 and each one produced at most a one- to two-day price pop followed by renewed selling.
That three-peat of failed catalysts is not random noise. It is a signal that the exit-liquidity dynamic is still dominant: existing holders are using positive news as a distribution window, not an accumulation trigger. The real bullish setup for DOGE in 2026 is not in another headline — it is in the exhaustion of that distribution, which on-chain data suggests may be approaching.
Current State of the Dogecoin Market
As of late March 2026, Dogecoin trades at approximately $0.095, giving it a market capitalization of roughly $14.9 billion. It remains the ninth-largest cryptocurrency globally by market cap — a position that, remarkably, it has held through multiple market cycles despite having no smart contract functionality, no staking yield, no DeFi ecosystem, and an unlimited inflationary supply.
The 52-week range is stark: from a high of $0.484 (reached during the November 2024 post-election euphoria cycle) to a low near $0.080 in early 2026. That means DOGE has lost approximately 80% of its value from cycle peak to current levels — an underperformance even by altcoin standards, where 70–80% drawdowns are typical in bear market phases. Investing.com’s historical data confirms the 12-month price change at approximately −48%, meaning DOGE has roughly halved in USD terms over the past year.
Daily active addresses on the Dogecoin network hold steady at 60,000 to 110,000 — a range that signals network stability but not growth. The circulating supply stands at approximately 153.5 billion DOGE, with roughly 5 billion new coins minted annually. At current prices, that annual inflation adds approximately $475 million in new supply per year that demand must absorb simply to hold price flat — a persistent structural headwind that most retail investors fail to account for in their price models.
Recent Ecosystem Developments
The institutional product landscape for DOGE has expanded materially over the past six months. The REX-Osprey DOGE ETF (ticker: DOJE) launched on the Cboe BZX Exchange on September 18, 2025, attracting nearly $17 million in first-day inflows — a meaningful but ultimately modest figure compared to Bitcoin ETF launches. The 21Shares TDOG followed on Nasdaq in January 2026 as the first product with Dogecoin Foundation backing and SEC-cleared spot exposure. Total assets under management across DOGE ETF products reached approximately $8.34 million by early 2026.
On the development side, DogeOS raised $6.9 million from investors including Polychain Capital to build a ZK-proof application layer for Dogecoin — an infrastructure project targeting mainnet launch in Q3 2026 that would, if successful, bring smart-contract-like capabilities to the chain. The Dogecoin Foundation is also developing the “Such App,” a self-custodial wallet and merchant payment tool slated for the first half of 2026. These are real development signals, but they represent long lead times before any on-chain utility demand materializes.
Most consequentially, X Money — Elon Musk’s payments platform — entered closed beta in early March 2026 with a public launch announced for April. No official DOGE integration has been confirmed, but this remains the single highest-impact unconfirmed catalyst in DOGE’s history.
The Pattern No One Is Modeling: Whale Distribution vs. Musk Signal Decay
The relationship between Elon Musk’s public statements about Dogecoin and DOGE’s subsequent price action has undergone a measurable structural change. In 2021, a single Musk tweet could produce 30–100% moves in hours. In 2023, the effect was still reliable but smaller — 15–25% moves. By late 2025, a viral Musk post about DOGE on March 20, 2026 failed to produce any sustained rally at all, with price quickly retracing to the mid-$0.09s.
This “Musk signal decay” has coincided with a specific whale behavior pattern that on-chain analytics reveal. According to Santiment and blockchain data, whale wallets (holding 1M to 100M DOGE) show extreme oscillation: 310 million DOGE bought in 48 hours during one accumulation window in July 2025, followed by 1 billion DOGE sold over seven days in November 2025. In March 2026, whales purchased 1.7 billion DOGE worth approximately $285 million — yet the price barely moved.
The Hidden Signal
When whale accumulation of $285M in a 30-day window does not move a $15B market cap asset, it tells you two things simultaneously: (1) there is an equally large or larger counter-force distributing into those buys, and (2) the asset is approaching absorption — the point where sellers are finally exhausted. This dynamic is historically a late-stage bottoming signal, not a continuation of the downtrend.
The correlation coefficient between DOGE and Bitcoin has also shifted. Historically, DOGE maintained a 0.75+ 90-day correlation with BTC. By early 2026, that figure had dropped to approximately 0.62 — a meaningful divergence suggesting DOGE is developing partial price independence. This cuts both ways: in Bitcoin bull runs, DOGE once amplified BTC gains by 3–5x. With lower correlation, that amplification may be dampened. But it also means DOGE may find independent catalyst-driven rallies that do not require a broader crypto bull market as a precondition.
Technical Analysis: What the Chart Is Actually Saying
The weekly DOGE/USD chart presents a descending triangle formation that has contained every rally attempt since mid-2025. The structure shows a series of lower highs — roughly $0.484 (November 2024), $0.25 (January 2025), $0.17 (mid-2025), $0.11 (January 2026) — pressing down against a horizontal base support zone between $0.080 and $0.095.
On the daily timeframe, DOGE printed a tentative double-bottom pattern in the $0.080–$0.088 range in early 2026, followed by a recovery to the $0.10–$0.104 resistance zone. That resistance level has now been tested twice without a clean breakout, and sellers regained control both times near $0.103. The 50-day moving average sits near $0.12, acting as overhead resistance, while the 200-day moving average is positioned near $0.17–$0.18.
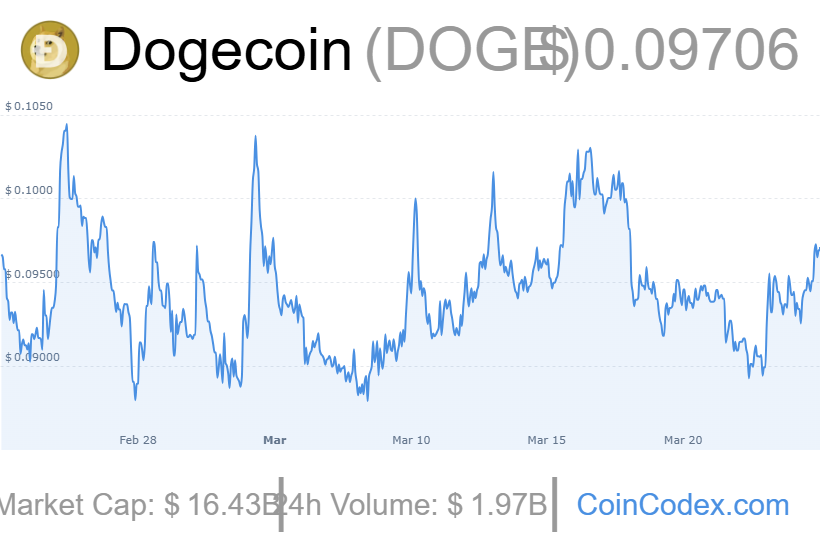
Chart Description: Key Price Levels
Critical Support Zone — $0.080 to $0.092: This range has acted as the floor three times in 2026. A sustained close below $0.080 would likely trigger a move toward $0.065–$0.070 — a level last seen in late 2023. The $0.09 level, specifically, aligns with the lower Bollinger Band and a major psychological threshold that retail holders defend aggressively.
First Resistance — $0.103 to $0.115: This cluster includes the 20-day SMA, recent rejection highs, and where 11.72 billion DOGE in aggregate were purchased by buyers now sitting at breakeven or slight loss. Any sustained move above $0.115 on volume would signal a structural change.
Major Resistance — $0.17 to $0.20: The 200-day SMA and a prior consolidation zone. Roughly 11.72 billion DOGE were accumulated by wallets in this range during 2025, creating a wall of supply that will need to be absorbed before any significant upside extension.
Bull Case Target — $0.35 to $0.50: The 2024 cycle peak zone. Reaching this level in 2026 would require sustained ETF inflows, X Money/DOGE integration confirmation, and a broad altcoin season catalyzed by Bitcoin maintaining above $90,000.
Dogecoin Price Prediction 2026 — Multi-Timeframe Forecast
| Timeframe | Min. Price | Avg. Price | Max. Price | Key Drivers |
|---|---|---|---|---|
| Weekly (Apr 2026) | $0.082 | $0.098 | $0.115 | BTC holding $80K+ support; RSI recovery from oversold; X Money sentiment |
| Monthly (Q2 2026) | $0.079 | $0.118 | $0.165 | Altcoin season timing; DogeOS development milestone; Such App launch; ETF accumulation |
| Mid-Year (Jun 2026) | $0.085 | $0.145 | $0.260 | X Money DOGE integration (if confirmed); BTC new ATH catalyst; MiCA institutional inflows |
| Year-End (Dec 2026) | $0.075 | $0.195 | $0.420 | Full-cycle bull market; spot ETF AUM growth; X platform utility; CLARITY Act tailwinds |
| 2027–2028 (Cycle Peak) | $0.080 | $0.350 | $0.750 | Historical 4-year cycle; DogeOS smart contract layer; institutional adoption maturation |
Technical Indicators Summary — DOGE/USD (March 2026)
| Indicator | Current Value | Signal | Interpretation |
|---|---|---|---|
| RSI (14-Day) | ~32–44 | Bearish/Neutral | Near oversold territory; RSI at 31–32 on weekly signals historical bottoming zone. A move above 50 is required to confirm bullish momentum shift. |
| MACD (12,26) | −0.002 | Bearish | MACD line below signal line; histogram near zero, suggesting bearish momentum is weakening but not reversing. A positive histogram crossover is the key confirmation to watch. |
| 50-Day SMA | ~$0.12 | Bearish | Price trading well below the 50-day SMA; this level acts as dynamic resistance. Reclaiming $0.12 would be a major momentum shift signal. |
| 200-Day SMA | ~$0.17–0.18 | Bearish | DOGE is approximately 45–50% below its 200-day SMA, indicating a deep bearish trend on a macro basis. This is also where peak distribution pressure is likely to emerge on recovery. |
| Bollinger Bands | Lower: $0.089 / Mid: $0.10 / Upper: $0.11 | Neutral | Price oscillating near middle/lower band. Tight band width suggests volatility compression — historically a precursor to an explosive directional move. Watch for band expansion. |
| ATR (14-Day) | ~$0.010 | Neutral | Low volatility relative to DOGE’s history. Volatility contraction at support is a setup indicator. A spike in ATR above $0.015 typically precedes a 20%+ directional move. |
| Weekly Trend | Lower Highs | Bearish | Descending triangle pattern intact. Lower highs since November 2024 peak. Structure only breaks on a weekly close above $0.12 with volume confirmation. |
| Support / Resistance | S: $0.089 / R: $0.103 | Neutral | Price compressed in a $0.014 range. The longer this compression continues, the more violent the eventual breakout or breakdown will be. |
Sentiment Analysis — DOGE Market Ecosystem (March 2026)
| Metric | Current Level | Trend | Impact on Price |
|---|---|---|---|
| Crypto Fear & Greed Index | Extreme Fear (est. 20–28) | ↓ Declining | Contrarian bullish setup. Historical pattern shows major DOGE bottoms form when community sentiment reaches multi-year lows — consistent with current readings. |
| Social Sentiment (LunarCrush) | New Holders −87% | ↓ Negative | 87% decline in new holder registration mirrors early-February patterns that preceded a 23% drawdown. Signals retail flight — bearish near-term, but an exhaustion indicator medium-term. |
| Musk Influence Signal | Diminished — March post produced no rally | ↓ Decaying | Each cycle, Musk’s tweets produce smaller, shorter price effects. The March 2026 non-response to a viral post is a watershed moment confirming the narrative engine is losing fuel. |
| Community Organic Activity | High (unpaid advocates active) | → Stable | The Dogecoin community remains one of the most organically active in crypto. This provides a sentiment floor and ensures DOGE retains viral potential, even without celebrity catalysts. |
| Institutional Sentiment | Cautious accumulation | ↑ Improving slowly | 55% of traditional hedge funds had digital asset exposure in 2025 (AIMA/PwC). Commodity classification removes a key deterrent. ETF AUM growing, but slowly. Net effect: mildly bullish structural signal over 12–18 months. |
| Whale Behavior | 1.7B DOGE accumulated in March | ↔ Mixed | Large accumulation exists, but price non-response suggests simultaneous distribution by other whale cohorts. Net whale positioning is roughly neutral, with the balance likely to tip as retail exhaustion completes. |
| X Money / DOGE Integration Speculation | High, unconfirmed | → Binary Event Risk | X Money public launch expected April 2026. This is the highest-impact binary event on DOGE’s 2026 calendar. Confirmation = potential 50–200% move. Absence of integration = significant narrative collapse. |
Looking Further: Dogecoin Price Prediction 2027–2028
The 4-year Bitcoin halving cycle which occurred in April 2024 has historically marked the starting point of a 12–18 month bull phase, with peak prices typically arriving between 12 and 24 months post-halving. This puts the projected cycle peak between April 2025 and October 2026. DOGE’s underperformance in the early phase of this cycle (−48% over 12 months) has created what some on-chain analysts describe as a coiled spring dynamic: historically, DOGE tends to be one of the last assets to rally in a bull cycle and one of the most explosive when it does.
If DOGE follows historical pattern and reaches its cycle peak in late 2026 or early 2027, the range of $0.35–$0.75 represents the realistic distribution of outcomes not $5, not $0.10. The $0.75 scenario requires market conditions nearly as favorable as the 2021 peak combined with a confirmed X Money integration. The $0.35 scenario requires only sustained Bitcoin above $100K and organic altcoin season rotation.
By 2027–2028, the DogeOS smart contract layer could, if functional, create a new demand vector entirely: DeFi applications, NFT markets, and payment rails built on a chain with near-zero transaction fees and brand recognition that no new chain can replicate. Whether that infrastructure actually arrives and attracts developers is the critical long-term question that separates a $0.35 outcome from a $0.75+ one.
Conclusion: What the Dogecoin Price Prediction for 2026 Actually Tells Us
The Dogecoin price prediction 2026 story is not about whether DOGE will go up. It almost certainly will, at some point. The real question is: what kind of move, driven by what catalyst, from what structural setup?
The setup right now is a deeply oversold asset with three failed catalysts (ETF launches, commodity classification) creating the surface appearance of a broken investment thesis. But beneath that surface, whale accumulation is persistent, institutional product infrastructure is in place for the first time in DOGE’s history, and a single unconfirmed binary event (X Money integration) retains the potential to change the demand equation overnight for 600 million platform users.
The technical structure says: wait for $0.115 to break with volume before chasing. The on-chain structure says: distribution is close to exhausting. The macro structure says: DOGE needs Bitcoin above $80K as a floor. The fundamental structure says: X Money confirmation is the one catalyst that changes the game.
The base case — a grind to $0.15–$0.25 by year-end — is prosaic but coherent. The bull case — $0.35 to $0.50 — is data-supported and dependent on a small number of confirmable events. And the regulatory paradox at the center of this analysis remains the most important signal: when good news stops working, you are getting close to the point where nothing is left to sell.

Henry Cross is a dedicated crypto writer and market researcher with over a decade of hands on experience in blockchain and digital assets. He focuses on simplifying complex topics while tracking fast moving trends across Bitcoin, altcoins, and emerging Web3 ecosystems. His work aims to help both new and experienced investors make informed decisions through clear analysis and practical insights.
Henry currently contributes to leading crypto platforms, where he delivers market breakdowns, price outlooks, and educational content. Over the years, his articles have appeared on several well known crypto media sites, building a reputation for reliable and easy to understand reporting. Alongside his writing, he shares beginner friendly guides and learning resources for readers who want to explore crypto without confusion.